Multiple Choice
The graph below depicts the cost structure for a firm in a competitive market.
Figure 9-13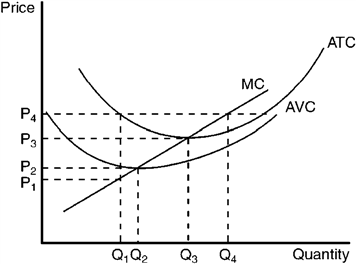
Refer to Figure 9-13. When price rises from P2 to P3, the firm finds that
A) marginal cost exceeds marginal revenue at a production level of Q2.
B) if it produces at output level Q3 it will earn a positive profit.
C) expanding output to Q4 would leave the firm with losses.
D) it could increase profits by lowering output from Q3 to Q2.
Correct Answer:

Verified
Correct Answer:
Verified
Q1: In the competitive price-taker model, individual firms
Q49: If a profit-maximizing firm shuts down in
Q52: A price-taker market tends toward a state
Q53: If you were the owner of a
Q57: If the demand for a product increases
Q60: Figure 9-12 <img src="https://d2lvgg3v3hfg70.cloudfront.net/TBX9057/.jpg" alt="Figure 9-12
Q66: When the conditions in a competitive price-taker
Q73: Which of the following statements best reflects
Q121: Suppose the development of new drought-resistant hybrid
Q182: If a price taker in a competitive