Multiple Choice
The figure below illustrates the cost and revenue structure for a monopoly firm.
Figure 11-17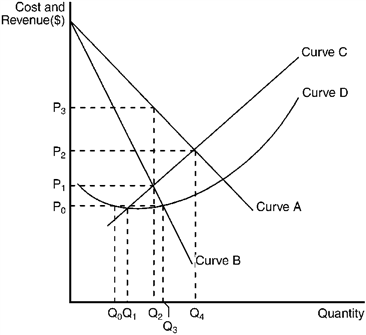
Refer to Figure 11-17. The marginal revenue curve for a monopoly firm is depicted by curve
A) A.
B) B.
C) C.
D) D.
Correct Answer:

Verified
Correct Answer:
Verified
Q2: Economic analysis suggests that patent laws that
Q19: Use the figure to answer the following
Q20: Figure 11-21 <img src="https://d2lvgg3v3hfg70.cloudfront.net/TBX9057/.jpg" alt="Figure 11-21
Q22: The key element in preserving a monopoly
Q23: The figure below illustrates the cost and
Q25: Figure 11-20 <img src="https://d2lvgg3v3hfg70.cloudfront.net/TBX9057/.jpg" alt="Figure 11-20
Q26: Use the table to answer the following
Q27: Use the figure to answer the following
Q28: The figure below illustrates the cost and
Q34: Collusion<br>A) is exactly the same thing as