Multiple Choice
The figure below illustrates the cost and revenue structure for a monopoly firm.
Figure 11-17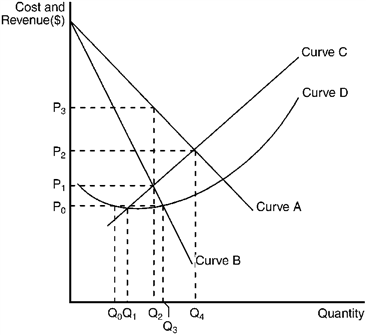
Refer to Figure 11-17. If the monopoly firm is currently producing Q3 units of output, then a decrease in output will necessarily cause profit to
A) remain unchanged.
B) decrease.
C) increase as long as the new level of output is at least Q2.
D) increase as long as the new level of output is at least Q1.
Correct Answer:

Verified
Correct Answer:
Verified
Q22: The key element in preserving a monopoly
Q23: The figure below illustrates the cost and
Q24: The figure below illustrates the cost and
Q25: Figure 11-20 <img src="https://d2lvgg3v3hfg70.cloudfront.net/TBX9057/.jpg" alt="Figure 11-20
Q26: Use the table to answer the following
Q27: Use the figure to answer the following
Q30: Which of the following is true of
Q56: "Market power" is an expression used to
Q109: At his current level of output, a
Q200: Under which of the following market conditions