Multiple Choice
Exhibit 5-8 Supply and demand curves for good X
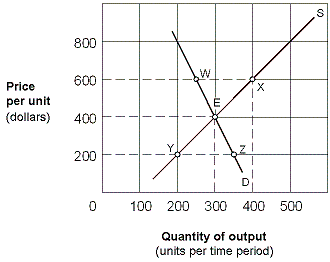
In Exhibit 5-8, the price elasticity of supply for good X between points Y and E is:
A) 1/5 = 0.20.
B) 5/3 = 1.66.
C) 3/5 = 0.60.
D) 1.
Correct Answer:

Verified
Correct Answer:
Verified
Related Questions
Q84: As the economy recovers from a recession,
Q85: Exhibit 5-7 Demand curve for concert tickets<br><br><img
Q86: If a consumer's purchases of a product
Q87: Exhibit 5-9 Supply and Demand Curves for
Q88: Price elasticity of demand refers to the
Q90: You are part of a local community
Q91: An excise tax levied on a product
Q92: In the very short-run period,<br>A) the price
Q93: Which of the following describes a situation
Q94: If the price elasticity of demand is