Multiple Choice
Exhibit 5-9 Supply and Demand Curves for Good X
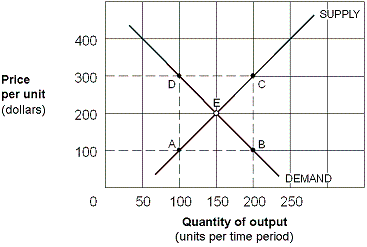
As shown in Exhibit 5-9, the $200 per unit tax on Good X raises tax revenue per time period totaling:
A) $10,000.
B) $20,000.
C) $30,000.
D) $60,000.
Correct Answer:

Verified
Correct Answer:
Verified
Related Questions
Q82: As one moves down a straight-line, down-sloping
Q83: Since it is always a negative number,
Q84: As the economy recovers from a recession,
Q85: Exhibit 5-7 Demand curve for concert tickets<br><br><img
Q86: If a consumer's purchases of a product
Q88: Price elasticity of demand refers to the
Q89: Exhibit 5-8 Supply and demand curves for
Q90: You are part of a local community
Q91: An excise tax levied on a product
Q92: In the very short-run period,<br>A) the price