Multiple Choice
Exhibit 5-8 Supply and demand curves for good X
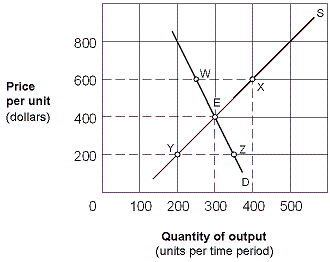
In Exhibit 5-8, the price elasticity of supply for good X between points E and X is:
A) 7/5 = 1.40.
B) 1/5 = 0.20.
C) 5/7 = 0.71.
D) 1.
Correct Answer:

Verified
Correct Answer:
Verified
Related Questions
Q61: The elastic portion of the downward-sloping straight-line
Q62: Good A has a price elasticity of
Q63: Exhibit 5-1 Demand curve<br><br><img src="https://d2lvgg3v3hfg70.cloudfront.net/TBX8793/.jpg" alt="Exhibit 5-1
Q64: In the long run, price elasticities of
Q65: In order to prove that Dr. Pepper
Q67: Exhibit 5-9 Supply and Demand Curves for
Q68: If demand for a good is elastic,
Q69: The responsiveness of suppliers to changing prices
Q70: Using supply and demand analysis, which of
Q71: The demand for a product is likely