Multiple Choice
Exhibit 1A-2 Straight line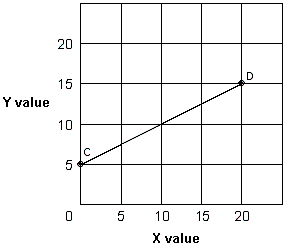
In Exhibit 1A-2, explain the slope of straight line CD.
A) As the X value increases by 20, the Y value increases by 5, so the slope is 4.
B) As the Y value increases by 5, the X value increases by 20, so the slope is 1/4.
C) As the X value increases by 10, the Y value increases by 5, so the slope is 2.
D) As the Y value increases by 5, the X value increases by 10, so the slope is 1/2.
Correct Answer:

Verified
Correct Answer:
Verified
Q133: The short-run aggregate supply curve (SRAS) is
Q134: Which of the following pairs is the
Q135: Economic growth can be represented by a
Q136: When an inverse relationship is graphed, the
Q137: Exhibit 10A-6 Aggregate demand and supply model<br><br><img
Q139: Economic growth is represented by a:<br>A) leftward
Q140: Exhibit 1A-7 Straight line relationship<br><img src="https://d2lvgg3v3hfg70.cloudfront.net/TBX8793/.jpg" alt="Exhibit
Q141: Exhibit 16A-2 Macro AD/AS Models<br><br><img
Q142: In the long run, a decrease
Q143: Exhibit 1A-1 Straight line<br><img src="https://d2lvgg3v3hfg70.cloudfront.net/TBX8793/.jpg" alt="Exhibit 1A-1