Multiple Choice
Exhibit 1A-7 Straight line relationship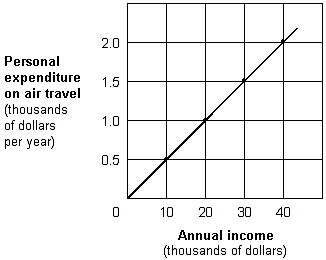
Which of the following would cause a shift in the relationship shown in Exhibit 1A-7?
A) A rise in people's annual income.
B) A rise in people's expenditure on air travel.
C) A rise in the price of air travel.
D) Nothing will shift the line in the graph.
Correct Answer:

Verified
Correct Answer:
Verified
Q135: Economic growth can be represented by a
Q136: When an inverse relationship is graphed, the
Q137: Exhibit 10A-6 Aggregate demand and supply model<br><br><img
Q138: Exhibit 1A-2 Straight line<br><img src="https://d2lvgg3v3hfg70.cloudfront.net/TBX8793/.jpg" alt="Exhibit 1A-2
Q139: Economic growth is represented by a:<br>A) leftward
Q141: Exhibit 16A-2 Macro AD/AS Models<br><br><img
Q142: In the long run, a decrease
Q143: Exhibit 1A-1 Straight line<br><img src="https://d2lvgg3v3hfg70.cloudfront.net/TBX8793/.jpg" alt="Exhibit 1A-1
Q144: Exhibit 6A-5 Consumer Equilibrium<br><br><img src="https://d2lvgg3v3hfg70.cloudfront.net/TBX8793/.jpg" alt="Exhibit 6A-5
Q145: Assuming the economy is experiencing a recessionary