Multiple Choice
NAEP: The pie chart below shows the portion of time Brooklyn spent on homework in each subject last week.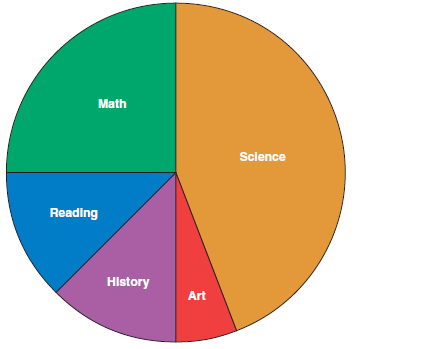
If Brooklyn spent two hours on mathematics, about how many hours did Brooklyn spend on homework altogether?
A) 4 hours
B) 8 hours
C) 12 hours
D) 16 hours
Correct Answer:

Verified
Correct Answer:
Verified
Q19: Which of these measures of central tendency
Q20: Is it possible to create stem-and-leaf plots
Q21: Circle graphs are used to illustrate:<br>A)categorical data.<br>B)numerical
Q22: A box-and-whisker plots graphically displays:<br>A)the mean, the
Q23: A student asks you to explain why
Q25: TIMSS: The graph below shows the number
Q26: In order to determine the favorite ice
Q27: Which of the following is not a
Q28: The mode can be determined for:<br>A)numerical data
Q29: Children have difficulty deciding when the mode,