Multiple Choice
TIMSS: The graph below shows the number of pens, pencils, rulers, and erasers sold by a store in one week.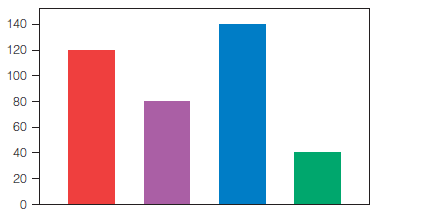
The names of the items are missing from the graph. Pens were the item most often sold, and fewer erasers than any other items were sold. More pencils than rulers were sold. How many pencils were sold?
A) 40 pencils
B) 80 pencils
C) 120 pencils
D) 140 pencils
Correct Answer:

Verified
Correct Answer:
Verified
Q20: Is it possible to create stem-and-leaf plots
Q21: Circle graphs are used to illustrate:<br>A)categorical data.<br>B)numerical
Q22: A box-and-whisker plots graphically displays:<br>A)the mean, the
Q23: A student asks you to explain why
Q24: NAEP: The pie chart below shows the
Q26: In order to determine the favorite ice
Q27: Which of the following is not a
Q28: The mode can be determined for:<br>A)numerical data
Q29: Children have difficulty deciding when the mode,
Q30: Find the median of the following set:<br>{7,