Not Answered
A TV reporter showed this graph during a newscast and said: "The graph shows that there is a huge increase in the number of robberies from 2016 to 2017."
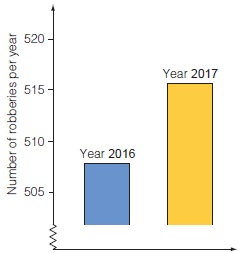
Do you consider the reporter's statement to be a reasonable interpretation of the graph? Give an explanation to support your answer.
Correct Answer:

Verified
Correct Answer:
Verified
Q33: Data collection is more meaningful for younger
Q34: A line plot is:<br>A)another name for a
Q35: A line graph could be used in
Q36: In order to find the class average
Q37: What are two misconceptions children are prone
Q38: Prerequisites for constructing circle graphs include all
Q39: Comparing a bar graph to a histogram,
Q40: Circle graphs are difficult for children to
Q41: The difference between an object graph and
Q42: An outlier will affect which of the