Multiple Choice
The figure below shows the short-run aggregate supply curve of an economy. In this figure, a recessionary gap would be represented by the distance between: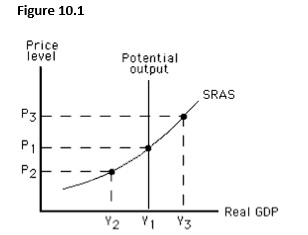
A) Y1and Y2.
B) Y1and Y3.
C) Y2and Y3.
D) P3and P1.
E) P3and P2.
Correct Answer:

Verified
Correct Answer:
Verified
Related Questions
Q2: The figure below shows equilibrium in an
Q6: Which of the following is true?<br>A)The nominal
Q7: The figure given below depicts long run
Q39: The nominal cost per unit of output
Q42: In the long run,a decrease in aggregate
Q80: Which of the following is true if
Q84: If the price level in the current
Q89: In the long run,an economy will produce
Q110: Which of these changes is observed in
Q118: If the expected price level exceeds the