Multiple Choice
The figure given below depicts long run equilibrium in an aggregate demand-aggregate supply model. Which of these could have caused the movement shown in this figure?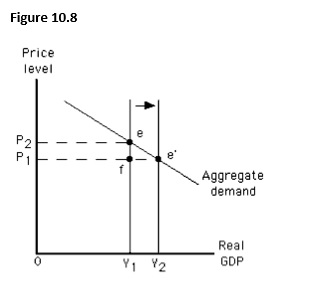
A) A decrease in the size of the labor force
B) An increase in the price level
C) An increase in net investment
D) An increase in autonomous consumption
E) A decrease in autonomous consumption
Correct Answer:

Verified
Correct Answer:
Verified
Q2: The figure below shows equilibrium in an
Q5: The figure below shows the short-run aggregate
Q6: Which of the following is true?<br>A)The nominal
Q39: The nominal cost per unit of output
Q42: In the long run,a decrease in aggregate
Q59: Which of the following if true would
Q80: Which of the following is true if
Q89: In the long run,an economy will produce
Q110: Which of these changes is observed in
Q118: If the expected price level exceeds the