Multiple Choice
The figure below shows the short-run aggregate demand and supply curves of an economy. When real GDP is at Y2, _____.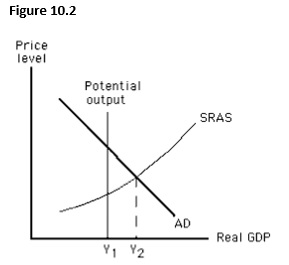
A) potential output is greater than actual output.
B) there is a recessionary gap.
C) the price level is likely to fall.
D) the actual unemployment rate is less than the natural rate of unemployment.
E) aggregate demand is likely to increase to restore equilibrium.
Correct Answer:

Verified
Correct Answer:
Verified
Q8: If the actual price level is less
Q15: Which of the following explains the shape
Q33: The short-run aggregate supply curve:<br>A)is positively sloped.<br>B)is
Q68: For the aggregate demand and aggregate supply
Q69: The figure below shows equilibrium in an
Q71: The long run is the period of
Q74: The figure below shows equilibrium in an
Q117: Suppose the actual and expected price levels
Q121: The natural rate of unemployment includes frictional,cyclical,and
Q122: The longer the unemployment rate remains above