Multiple Choice
The figure below shows equilibrium in an aggregate demand-aggregate supply model. The shift from AS to AS' in this figure represents a(n) :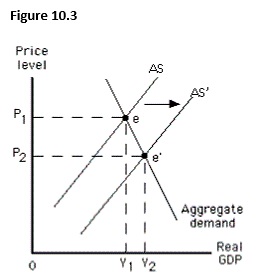
A) increase in short-run aggregate supply.
B) increase in long-run aggregate supply.
C) decrease in short-run aggregate supply.
D) decrease in long-run aggregate supply.
E) decrease in the aggregate quantity demanded.
Correct Answer:

Verified
Correct Answer:
Verified
Q2: In the aggregate demand-aggregate supply model,which of
Q15: Which of the following explains the shape
Q33: The short-run aggregate supply curve:<br>A)is positively sloped.<br>B)is
Q58: Which of the following is most likely
Q68: For the aggregate demand and aggregate supply
Q71: The figure below shows the short-run aggregate
Q74: The figure below shows equilibrium in an
Q117: Suppose the actual and expected price levels
Q121: The natural rate of unemployment includes frictional,cyclical,and
Q122: The longer the unemployment rate remains above