Multiple Choice
The figure below shows the equilibrium in an aggregate demand-aggregate supply model. In this figure, which of the following is true for an economy that is at point V in the short run?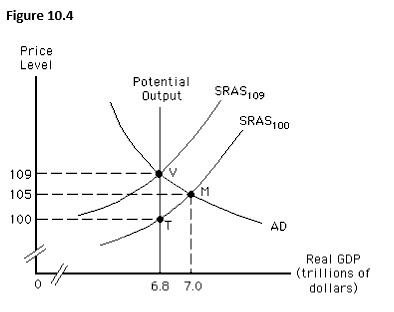
A) There is a recessionary gap worth $200 billion.
B) The potential output is $7 trillion.
C) The actual price level is 100.
D) The natural rate of unemployment is more than 6.8 trillion.
E) The actual output is equal to the potential output.
Correct Answer:

Verified
Correct Answer:
Verified
Q12: Potential output depends on all of the
Q32: Given the aggregate demand curve,an increase in
Q44: An adverse supply shock would shift:<br>A)only the
Q51: When the economy is at its potential
Q79: Which of the following supply shocks would
Q101: If nominal wage rates increase by 2
Q105: The figure given below depicts long run
Q105: The rate at which aggregate supply changes
Q109: The figure below shows short-run equilibrium in
Q146: Suppose the price level increases by 5