Multiple Choice
The figure given below depicts long run equilibrium in an aggregate demand-aggregate supply model. Which of the following is indicated by the arrow given in this figure?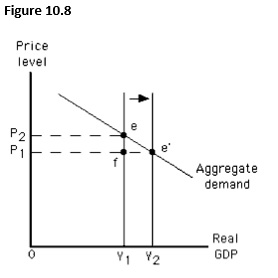
A) A decrease in capital stock
B) An increase in long-run aggregate supply
C) An increase in nominal wage
D) A decrease in long-run aggregate supply
E) A decrease in the aggregate quantity demanded
Correct Answer:

Verified
Correct Answer:
Verified
Q12: Potential output depends on all of the
Q32: Given the aggregate demand curve,an increase in
Q44: An adverse supply shock would shift:<br>A)only the
Q51: When the economy is at its potential
Q100: If the rate of increase in the
Q101: If nominal wage rates increase by 2
Q107: The figure below shows the equilibrium in
Q109: The figure below shows short-run equilibrium in
Q144: Which of the following is generally true
Q146: Suppose the price level increases by 5