Multiple Choice
The figure below shows short-run equilibrium in an aggregate demand-aggregate supply model. In this figure, the distance between points Y1 and Y2 represents: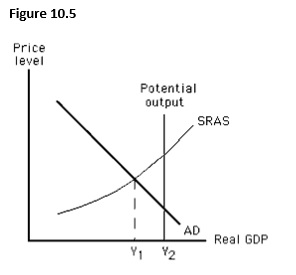
A) an expansionary gap.
B) a recessionary gap.
C) the potential output.
D) seasonal unemployment.
E) structural unemployment.
Correct Answer:

Verified
Correct Answer:
Verified
Q20: The figure given below depicts long-run equilibrium
Q24: Which of the following is most likely
Q31: In the long run,a leftward shift of
Q42: In the long run,a decrease in aggregate
Q59: Which of the following if true would
Q75: In the long run,the price level in
Q91: A recessionary gap develops:<br>A)when actual output exceeds
Q118: If the expected price level exceeds the
Q124: Which of the following is true in
Q143: If resource prices are flexible,the long-run aggregate