Multiple Choice
The figure given below depicts long-run equilibrium in the aggregate demand-aggregate supply model. Which of the following changes is depicted by the movement from Y1 to Y2?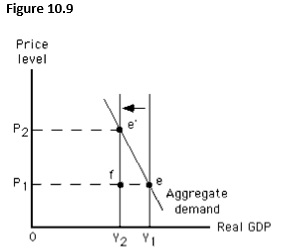
A) An increase in long-run aggregate supply
B) An increase in short-run aggregate supply
C) A decrease in short-run aggregate supply
D) A decrease in long-run aggregate supply
E) An increase in the aggregate quantity demanded
Correct Answer:

Verified
Correct Answer:
Verified
Q15: The figure below shows short-run equilibrium in
Q24: Which of the following is most likely
Q24: The figure below shows the determination of
Q31: In the long run,a leftward shift of
Q70: Which of the following is true of
Q75: In the long run,the price level in
Q91: A recessionary gap develops:<br>A)when actual output exceeds
Q137: Which of these is true of the
Q145: The main effect of an increase in
Q149: Which of the following supply shocks will