Multiple Choice
The figure below shows the determination of the equilibrium price level and real GDP in an aggregate demand-aggregate supply model. If the economy is at point H, there is a(n) :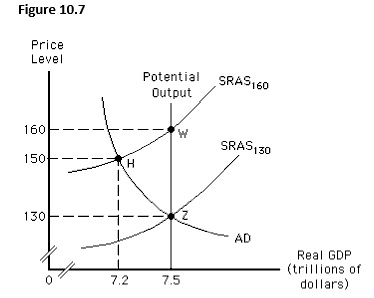
A) expansionary gap of $300 billion.
B) recessionary gap of $300 billion.
C) recessionary gap of $10 billion.
D) expansionary gap of $20 billion.
E) expansionary gap of $10 billion.
Correct Answer:

Verified
Correct Answer:
Verified
Q4: Workers usually negotiate compensation in terms of
Q20: The figure given below depicts long-run equilibrium
Q25: The international oil price hike by OPEC
Q29: The figure below shows the short-run aggregate
Q62: Which of these does not hold true
Q70: Which of the following is true of
Q75: In the long run,the price level in
Q137: Which of these is true of the
Q145: The main effect of an increase in
Q149: Which of the following supply shocks will