Multiple Choice
The figure given below shows equilibrium in a money market. If S is the initial supply curve, the movement from S to S* can be attributed to: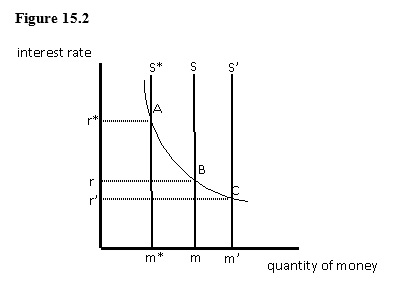
A) a decrease in the required reserve ratio.
B) the purchase of U.S. Treasury securities by the Fed.
C) the sale of U.S. Treasury securities by the Fed.
D) a decrease in the discount rate.
E) a decrease in excess reserves in the banking system.
Correct Answer:

Verified
Correct Answer:
Verified
Q13: For a given shift of the aggregate
Q24: The demand for money will be high
Q62: When the Fed purchases U.S.government securities through
Q68: To eliminate a recessionary gap,the Fed can:<br>A)increase
Q80: A movement upward and to the left
Q81: The figure given below shows the aggregate
Q93: The demand for money is a relationship
Q94: Suppose that the demand and supply of
Q108: If the money supply in an economy
Q116: Which of the following forms of money