Multiple Choice
The figure given below shows the aggregate demand curve and the short-run aggregate supply curve of an economy. In this figure, short-run equilibrium occurs at: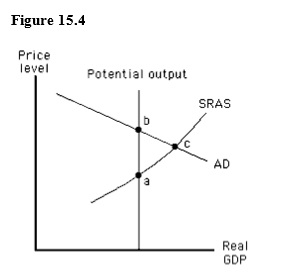
A) point b, where actual output exceeds potential output.
B) point a, where actual output exceeds potential output.
C) point c, where actual price level exceeds the expected price level.
D) point c, where the actual price level is less than the expected price level.
E) point b, where the actual price level exceeds the expected price level.
Correct Answer:

Verified
Correct Answer:
Verified
Q13: For a given shift of the aggregate
Q24: The demand for money will be high
Q60: In the money market,if the money supply
Q62: When the Fed purchases U.S.government securities through
Q66: An increase in the expected inflation rate
Q78: The figure given below shows equilibrium in
Q80: A movement upward and to the left
Q93: The demand for money is a relationship
Q115: The equation of exchange states that the
Q116: Which of the following forms of money