Essay
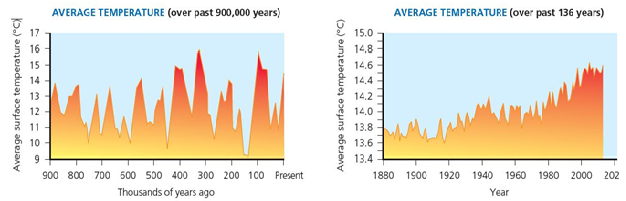
Figure 15.18
The two figures presented show surface temperatures over thousands of years (left) and over the last 136 years (right). Why can you clearly see a gradual temperature increase in the figure on the right but see much more variable temperatures in the figure on the left?
Correct Answer:

Verified
The figure on the right shows recent inc...View Answer
Unlock this answer now
Get Access to more Verified Answers free of charge
Correct Answer:
Verified
View Answer
Unlock this answer now
Get Access to more Verified Answers free of charge
Q90: <img src="https://d2lvgg3v3hfg70.cloudfront.net/TBX8829/.jpg" alt=" Figure 15.B
Q91: Carbon capture and storage (CCS) involves restoring
Q92: When the global average atmospheric temperature changes
Q93: What has released toxic ions of cadmium
Q94: Clearly describe a positive feedback loop associated
Q96: A good way to reduce exposure to
Q97: Compounds that can react and help neutralize
Q98: _ is a mixture of primary and
Q99: The world's average sea level is rising
Q100: Which of the following is categorized as