Essay
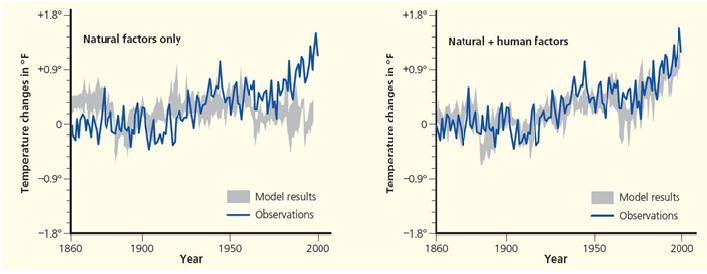
Figure 15.B for question 95.
Look at the accompanying figures that show observed climate data and the results of modeled projections either without (left) or with (right) human factors. Explain what you can conclude from these figures.
Correct Answer:

Verified
The projections of the model closely mat...View Answer
Unlock this answer now
Get Access to more Verified Answers free of charge
Correct Answer:
Verified
View Answer
Unlock this answer now
Get Access to more Verified Answers free of charge
Q85: In 1987, 36 nations meeting in Montreal,
Q86: <img src="https://d2lvgg3v3hfg70.cloudfront.net/TBX8829/.jpg" alt=" Figure 15.6
Q87: Which form of air pollution is most
Q88: Why do cities in warm and dry
Q89: What is the potential risk associated with
Q91: Carbon capture and storage (CCS) involves restoring
Q92: When the global average atmospheric temperature changes
Q93: What has released toxic ions of cadmium
Q94: Clearly describe a positive feedback loop associated
Q95: <img src="https://d2lvgg3v3hfg70.cloudfront.net/TBX8829/.jpg" alt=" Figure 15.18