Multiple Choice
Exhibit 20-3 Money market demand and supply curves 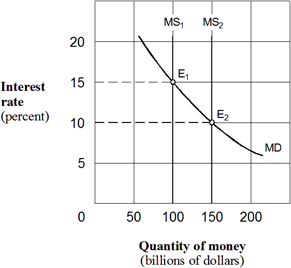 In Exhibit 20-3, assume an equilibrium with an interest rate of 15 percent and the money supply at $100 billion. The Fed uses its policy tools to move the economy to a new equilibrium at E2 with money supply of $150 billion and an interest rate of 10 percent. This change could be the result of a(n) :
A) open market sale of securities by the Fed.
B) higher discount rate set by the Fed.
C) higher required-reserve ratio set by the Fed.
D) open market purchase of securities by the Fed.
Correct Answer:

Verified
Correct Answer:
Verified
Q92: In Keynes's view, an excess quantity of
Q163: When a household takes extra (unbudgeted) money
Q164: Which type of demand for money causes
Q165: The Keynesian cause-and-effect sequence predicts that an
Q166: According to the quantity theory of money,
Q167: If M stand for the money supply,
Q169: Starting from equilibrium in the money market,
Q170: The Keynesian cause-and-effect sequence predicts that a
Q171: Exhibit 20A-2 Macro AD/AS Models <img src="https://d2lvgg3v3hfg70.cloudfront.net/TBX9287/.jpg" alt="Exhibit
Q172: Exhibit 20-3 Money market demand and supply curves