Multiple Choice
Exhibit 14-7 Aggregate supply and demand curves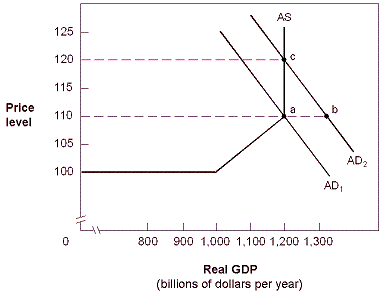
At point A in Exhibit 14-7, the aggregate demand AD2 and the aggregate supply curve reflect an economy in which
A) full employment is at $1,000 billion GDP.
B) excess aggregate supply is created when there is a shift from AD1 to AD2.
C) excess aggregate demand forces prices up to P = 120.
D) excess aggregate demand causes prices to stabilize at P = 110.
Correct Answer:

Verified
Correct Answer:
Verified
Q29: A reduction in regulation will shift the
Q40: To illustrate the classical argument that "supply
Q57: In the aggregate demand and supply model,
Q72: According to classical theory, if the aggregate
Q73: When the price level falls, the total
Q79: One reason for the short-run aggregate supply
Q94: In the long run, wages and
Q133: Along the short-run supply curve (SRAS), a
Q135: Exhibit 14-7 Aggregate supply and demand curves<br><img
Q139: Economic growth is represented by a:<br>A) leftward