Multiple Choice
The plot shown below represents a correlation that is 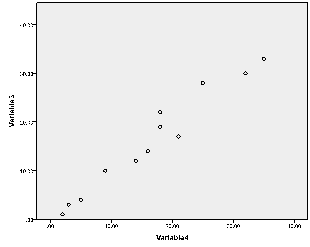
A) strong and positive.
B) weak and positive.
C) weak and negative
D) strong and negative.
Correct Answer:

Verified
Correct Answer:
Verified
Related Questions
Q33: One explanation for the negative effects of
Q34: When choosing a curriculum or intervention program,
Q35: In Urie Bronfenbrenner's bioecological model, the most
Q36: In Urie Bronfenbrenner's bioecological model, processes that
Q37: The plot shown below most likely represents
Q38: A test that measures what it claims
Q39: Experts find a strong relationship between reading
Q40: Which theory emphasizes the notion that humans
Q41: Research shows that different ethnic groups have
Q42: Which of the following is true of