Multiple Choice
Use the figure below to answer the following question(s) . Figure 4-7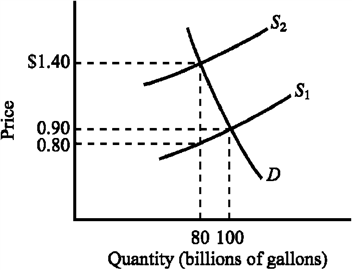 Refer to Figure 4-7. The supply curve S1 and the demand curve D indicate initial conditions in the market for gasoline. A $.60-per-gallon excise tax on gasoline is levied, which shifts the supply curve from S1 to S2. Imposing the tax causes the equilibrium price of gasoline to increase from
A) $.80 to $1.40.
B) $.80 to $1.50.
C) $.90 to $1.50.
D) $.90 to $1.40.
Correct Answer:

Verified
Correct Answer:
Verified
Q16: Rent controls tend to cause persistent imbalances
Q66: A law establishing a maximum legal price
Q131: About 35,000 general aviation multiengine airplanes are
Q170: Lowincomesville is a poor town. The mayor
Q188: The presence of price controls in a
Q194: A market that operates outside the legal
Q239: Use the figure below to answer the
Q240: Use the figure below to answer the
Q243: Use the table below to choose the
Q249: Use the figure below to answer the