Multiple Choice
Use the figure below to answer the following question(s) . Figure 4-12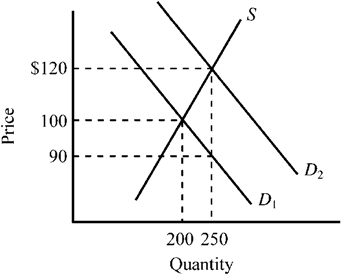 Refer to Figure 4-12. The supply curve S and the demand curve D1 indicate initial conditions in the market for college textbooks. A new government program is implemented that grants students a $30 per textbook subsidy on every textbook they purchase, shifting the demand curve from D1 to D2. Which of the following is true for this subsidy given the information provided in the exhibit?
A) Textbook buyers will receive an actual benefit of $10 from the subsidy, while textbook sellers will receive an actual benefit of $20 from the subsidy.
B) Textbook buyers will receive an actual benefit of $20 from the subsidy, while textbook sellers will receive an actual benefit of $10 from the subsidy.
C) Textbook buyers will receive the full $30 benefit from the subsidy.
D) Textbook sellers will receive the full $30 benefit from the subsidy.
Correct Answer:

Verified
Correct Answer:
Verified
Q10: The deadweight loss (or excess burden) resulting
Q40: A price ceiling that sets the price
Q57: If a $2 tax per bottle of
Q76: Figure 4-22 <img src="https://d2lvgg3v3hfg70.cloudfront.net/TBX9063/.jpg" alt="Figure 4-22
Q80: Use the figure below to answer the
Q82: Figure 4-17 <img src="https://d2lvgg3v3hfg70.cloudfront.net/TBX9063/.jpg" alt="Figure 4-17
Q83: Figure 4-22 <img src="https://d2lvgg3v3hfg70.cloudfront.net/TBX9063/.jpg" alt="Figure 4-22
Q154: The benefit of a subsidy will go
Q250: If a government price control succeeds in
Q270: If there was an increase in the