Multiple Choice
Use the figure below to answer the following question(s) . Figure 10-15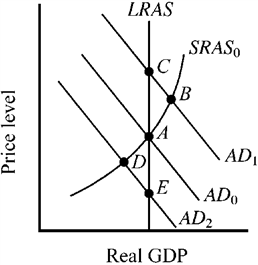 The economy's short-run (SRAS ) and long-run (LRAS) aggregate supply curves are shown in Figure 10-15, along with three alternative aggregate demand curves and the accompanying equilibrium points. At which point will resource prices naturally tend to increase?
A) A
B) B
C) C
D) D
Correct Answer:

Verified
Correct Answer:
Verified
Q143: Use the figure below to answer the
Q144: If business decision makers expect that the
Q145: Use the figure below to answer the
Q146: Which of the following will most likely
Q147: Use the figure below to answer the
Q149: Figure 10-18 <img src="https://d2lvgg3v3hfg70.cloudfront.net/TBX9063/.jpg" alt="Figure 10-18
Q150: An abnormally large grain crop due to
Q151: Suppose there is an unexpected increase in
Q152: An improvement in technology would shift which
Q153: If European economies experience strong economic growth,