Multiple Choice
Figure 10-18 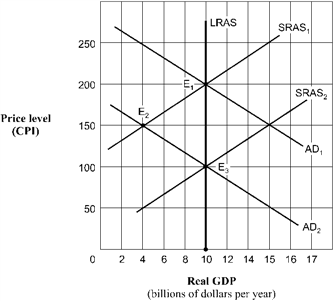 Given the shift of the aggregate demand curve from AD1 to AD2 in Figure 10-18, the real GDP and price level (CPI) in long-run equilibrium will be
A) $10 billion and 200.
B) $4 billion and 150.
C) $10 billion and 150.
D) $10 billion and 100.
Correct Answer:

Verified
Correct Answer:
Verified
Related Questions
Q144: If business decision makers expect that the
Q145: Use the figure below to answer the
Q146: Which of the following will most likely
Q147: Use the figure below to answer the
Q148: Use the figure below to answer the
Q150: An abnormally large grain crop due to
Q151: Suppose there is an unexpected increase in
Q152: An improvement in technology would shift which
Q153: If European economies experience strong economic growth,
Q154: A large grain crop resulting from favorable