Multiple Choice
Use the figure below to answer the following question(s) . Figure 10-15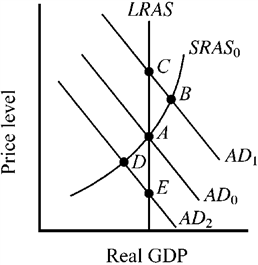 The economy's short-run (SRAS ) and long-run (LRAS) aggregate supply curves are shown in Figure 10-15, along with three alternative aggregate demand curves and the accompanying equilibrium points. At which point will resource prices naturally tend to decrease?
A) A
B) B
C) C
D) D
Correct Answer:

Verified
Correct Answer:
Verified
Q50: Figure 10-18 <img src="https://d2lvgg3v3hfg70.cloudfront.net/TBX9063/.jpg" alt="Figure 10-18
Q51: Which of the following would be most
Q52: Which of the following will most likely
Q53: When output is greater than the economy's
Q54: When the economy is operating at an
Q56: With regard to the business cycle, most
Q57: During 2003-2007, the price of crude oil
Q58: If the economy is operating at an
Q59: If the consumer sentiment index turns down
Q60: A currency appreciation will be most likely