Multiple Choice
Figure 10-18 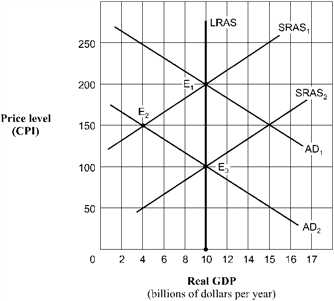 As shown in Figure 10-18, and assuming the aggregate demand curve shifts from AD1 to AD2, the full-employment level of real GDP is
A) $10 billion.
B) $4 billion.
C) $100 billion.
D) unable to be determined.
Correct Answer:

Verified
Correct Answer:
Verified
Related Questions
Q45: Use the figure below to answer the
Q46: Resource prices will fall and short-run aggregate
Q47: Which of the following was a contributing
Q48: Which is most likely to cause a
Q49: The short-run effect of a sudden increase
Q51: Which of the following would be most
Q52: Which of the following will most likely
Q53: When output is greater than the economy's
Q54: When the economy is operating at an
Q55: Use the figure below to answer the