Multiple Choice
The federal minimum wage, in dollars per hour, for the years 1955 to 2005 is given in the table below. Using the data from 1955 and 1975, find a linear model that predicts the federal minimum wage for the year t . Round to nearest hundredth. Year Federal Minimum Wage 1955 0.75 1965 1.25 1975 2.10 1985 3.35 1995 4.25 2005 5.15
A) 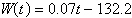
B) 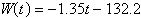
C) 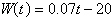
D) 
E) 
Correct Answer:

Verified
Correct Answer:
Verified
Q1: Given <img src="https://d2lvgg3v3hfg70.cloudfront.net/TBX8727/.jpg" alt="Given ,
Q3: Determine whether the following scatter diagram suggests
Q4: Use the graph of E, shown below,
Q5: A rental car company purchases an automobile
Q6: An air freight company has determined that
Q7: The table below gives the wingspan, in
Q8: The amount of federal income tax <img
Q9: For the piecewise-defined function below, find <img
Q10: Graph the following equation by plotting points
Q11: The sum of the length l and