Multiple Choice
Given the graph of the functions  and
and  . Identify which graph corresponds to
  .
. 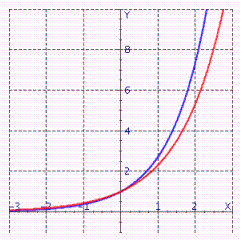 Select the correct answer.
A) Red
B) Blue
Correct Answer:

Verified
Correct Answer:
Verified
Related Questions
Q41: The given table corresponds to the function
Q42: In Russia the average consumer drank two
Q43: How long, to the nearest year, will
Q44: The table lists interest rates on long-term
Q45: Last year's epidemic of Martian flu began
Q47: Find the equation for the exponential function
Q48: Model the data using an exponential function
Q49: The table below is filled correctly. Exponential
Q50: Use logarithms to solve the equation. (Round
Q51: The chart shows the number of research