Short Answer
The chart shows the number of research articles in the prominent journal Physics Review that were written by researchers in Europe during 1983-2003 (  represents 1983).
 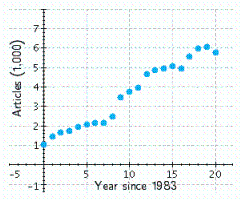 Which of the following logistic functions best models the data? (
  is the number of years since 1983.)Try to determine the correct model without actually computing data points.
(a) 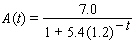
(B) 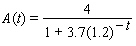
(c) 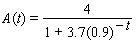
(D) 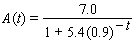 __________ According to the model you selected, at what percentage was the number of articles growing around 1984? __________%
Correct Answer:

Verified
Correct Answer:
Verified
Q46: Given the graph of the functions <img
Q47: Find the equation for the exponential function
Q48: Model the data using an exponential function
Q49: The table below is filled correctly. Exponential
Q50: Use logarithms to solve the equation. (Round
Q52: Find the y -intercept(s)of the graph of
Q53: The table is filled correctly. Exponential form
Q54: Convert the exponential function to the form
Q55: The following chart shows the value of
Q56: The given table corresponds to the function