Multiple Choice
Given the graph of the functions  and
and  . Determine the color of the graph that corresponds to
  .
. 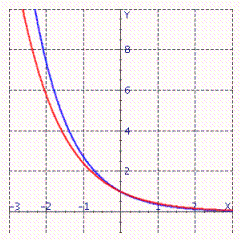 Select the correct answer.
A) Blue
B) Red
Correct Answer:

Verified
Correct Answer:
Verified
Related Questions
Q1: The fuel efficiency (in miles per gallon)of
Q2: How long will it take an investment
Q3: The table lists interest rates on long-term
Q4: The amount of carbon-14 remaining in a
Q6: The graph shows the actual percentage of
Q7: Soon after taking an aspirin, a patient
Q8: Plutonium-239 is used as a fuel for
Q9: Find the associated exponential decay model. <img
Q10: Find the vertex of the graph of
Q11: Choose the logistic function that best approximates