Short Answer
The graph shows the actual percentage of U.S. households with a computer as a function of household income (the data points)and a logistic model of these data (the curve). The logistic model is 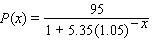 where
where  is the household income in thousands of dollars. According to the model, what percentage of extremely wealthy households had computers?
 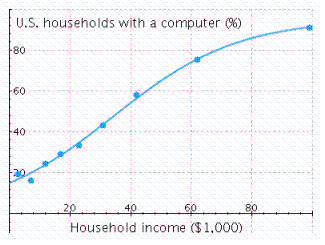 P = __________%
Correct Answer:

Verified
Correct Answer:
Verified
Q1: The fuel efficiency (in miles per gallon)of
Q2: How long will it take an investment
Q3: The table lists interest rates on long-term
Q4: The amount of carbon-14 remaining in a
Q5: Given the graph of the functions <img
Q7: Soon after taking an aspirin, a patient
Q8: Plutonium-239 is used as a fuel for
Q9: Find the associated exponential decay model. <img
Q10: Find the vertex of the graph of
Q11: Choose the logistic function that best approximates