Multiple Choice
The chart shows the number of research articles in the prominent journal Physics Review that were written by researchers in Europe during 1983-2003 (  represents 1983) .
 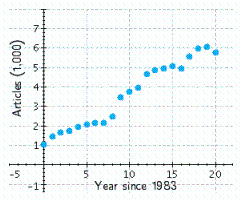 Which of the following logistic functions best models the data? (
  is the number of years since 1983.) Try to determine the correct model without actually computing data points.
A) 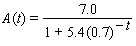
B) 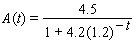
C) 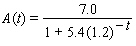
D) 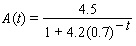
E) 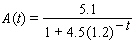
Correct Answer:

Verified
Correct Answer:
Verified
Q78: Graph the function. <img src="https://d2lvgg3v3hfg70.cloudfront.net/TBX8650/.jpg" alt="Graph the
Q79: Model the data using an exponential function
Q80: The given table corresponds to the function
Q81: Convert the exponential function to the form
Q82: How long, to the nearest year, will
Q83: There are currently 1,000 cases of Venusian
Q84: Convert the exponential function to the form
Q85: Graph the function. <img src="https://d2lvgg3v3hfg70.cloudfront.net/TBX8650/.jpg" alt="Graph the
Q86: How long, to the nearest year, will
Q87: The following graph shows the actual percentage