Multiple Choice
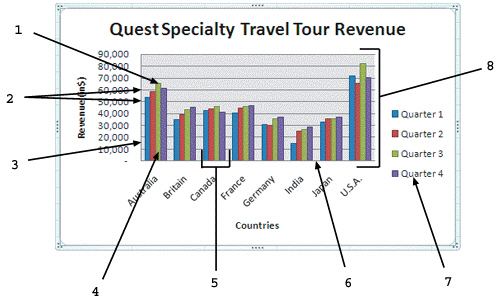 As shown in the figure above, item ____ represents a data point.
A) 1
B) 3
C) 4
D) 7
Correct Answer:

Verified
Correct Answer:
Verified
Related Questions
Q10: <img src="https://d2lvgg3v3hfg70.cloudfront.net/TBX9074/.jpg" alt=" As shown in
Q11: <img src="https://d2lvgg3v3hfg70.cloudfront.net/TBX9074/.jpg" alt=" The arrows shown
Q14: <img src="https://d2lvgg3v3hfg70.cloudfront.net/TBX9074/.jpg" alt=" As shown in
Q19: You are having trouble keeping track of
Q20: <img src="https://d2lvgg3v3hfg70.cloudfront.net/TBX9074/.jpg" alt=" As shown in
Q23: On a chart created in Excel, the
Q65: Sub gridlines show the values between the
Q104: Any data changed in the worksheet is
Q123: You can use buttons on the Insert
Q236: The z-axis of 3-D charts is used