Multiple Choice
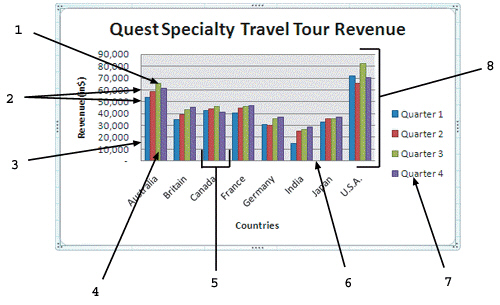 As shown in the figure above, item 7 represents ____.
A) data markers
B) tick marks
C) the plot area
D) the legend
Correct Answer:

Verified
Correct Answer:
Verified
Related Questions
Q6: You are a manager in the Sales
Q7: You can modify the data range and
Q9: A chart must be located in a
Q11: <img src="https://d2lvgg3v3hfg70.cloudfront.net/TBX9074/.jpg" alt=" The arrows shown
Q14: <img src="https://d2lvgg3v3hfg70.cloudfront.net/TBX9074/.jpg" alt=" As shown in
Q15: <img src="https://d2lvgg3v3hfg70.cloudfront.net/TBX9074/.jpg" alt=" As shown in
Q19: A scatter chart _.<br>A) compares distinct, unrelated
Q23: On a chart created in Excel, the
Q104: Any data changed in the worksheet is
Q407: Each value in a cell selected for