Short Answer
The following graph shows how the value of the average car depreciates as a percent of its original value over a 10-year period. It also shows the yearly maintenance costs as a percent of the car s value. 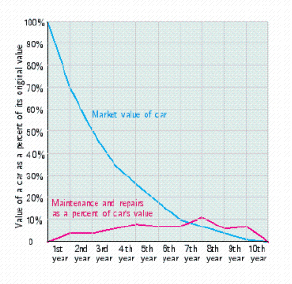 When is the car worth half of its purchase price?
At the end of the __________ year. When is the car worth 30% of its purchase price?
During the __________ year. When do the average yearly maintenance costs surpass the value of the car?
During the __________ year.
Correct Answer:

Verified
Correct Answer:
Verified
Q2: Compare the graph of <span
Q3: Find the length of time for $25000
Q4: The graph represents a function. Use
Q5: Solve the equation. Round answer to
Q6: Solve the equation. Give your answer
Q8: Evaluate: <span class="ql-formula" data-value="\ln \sqrt
Q9: Use the properties of logarithms to
Q10: Solve for x . <span
Q11: An equation with a variable in
Q141: The _ line test can be used