Multiple Choice
Use the data in the table to make a line graph showing the average acreage (in acres) of U.S. farms for the years 1950 through 1990.
A) 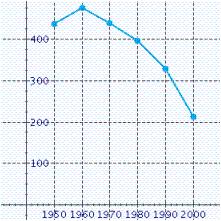
B) 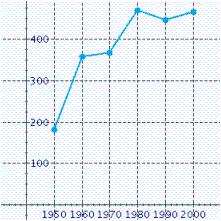
C) 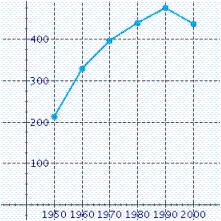
D) 
E) 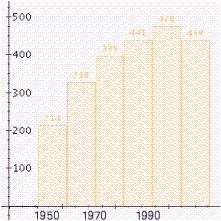
Correct Answer:

Verified
Correct Answer:
Verified
Related Questions
Q32: Which of the following illustrations is a
Q33: The magnitudes of the major earthquakes
Q34: Several computer stores reported differing prices for
Q35: Find the weighted mean of a
Q36: Refer to the following spinner. If
Q38: Raul has an adjusted income of $153,850,
Q39: Find the semester grade point average
Q40: Match the type of information with the
Q41: An ordinary die is rolled once.
Q42: Use the data in the table