menu-iconExamlexExamLexServices

Discover

Ask a Question
  1. All Topics
  2. Topic
    Business
  3. Study Set
    Foundations of Macroeconomics
  4. Exam
    Exam 6: Efficiency and Fairness of Markets
  5. Question
    The Figure Above Shows the Supply Curve for Pizza and the Market
Solved

The Figure Above Shows the Supply Curve for Pizza and the Market

Question 268

Question 268

Multiple Choice

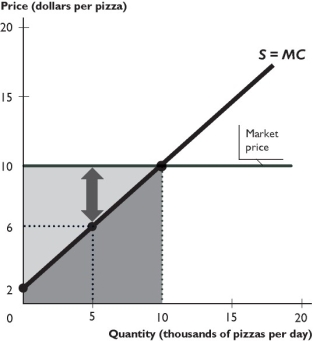
   The figure above shows the supply curve for pizza and the market price of pizza. -In the figure above,the cost of producing 10,000 pizzas a day is A)  $60,000. B)  $100,000. C)  $40,000. D)  $80,000. E)  $50,000.
The figure above shows the supply curve for pizza and the market price of pizza.
-In the figure above,the cost of producing 10,000 pizzas a day is


A) $60,000.
B) $100,000.
C) $40,000.
D) $80,000.
E) $50,000.

Correct Answer:

verifed

Verified

Unlock this answer now
Get Access to more Verified Answers free of charge

Related Questions

Q57: How can a person argue that health

Q263: Canned milk was only rationed to babies

Q264: <img src="https://d2lvgg3v3hfg70.cloudfront.net/TB1458/.jpg" alt=" The figure

Q266: <img src="https://d2lvgg3v3hfg70.cloudfront.net/TB1458/.jpg" alt=" -The figure above

Q267: Which of the following is part of

Q269: When the marginal cost of producing a

Q270: What must be true for a consumer

Q271: Shelby said to her friend,"I just bought

Q272: The supply curve shows the<br>A) marginal benefit

Q273: Allocative efficiency occurs<br>A) anywhere inside or on

Examlex

ExamLex

About UsContact UsPerks CenterHomeschoolingTest Prep

Work With Us

Campus RepresentativeInfluencers

Links

FaqPricingChrome Extension

Download The App

Get App StoreGet Google Play

Policies

Privacy PolicyTerms of ServiceHonor CodeCommunity Guidelines

Scan To Download

qr-code

Copyright © (2025) ExamLex LLC.

Privacy PolicyTerms Of ServiceHonor CodeCommunity Guidelines