Short Answer
The following graph shows the relationship between a company s profits P and the number of items it sells x . ( P is in dollars.) What is their maximum profit? 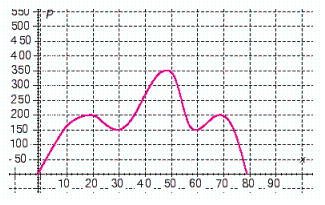 $__________
Correct Answer:

Verified
Correct Answer:
Verified
Related Questions
Q136: Find the slope of the line from
Q137: Find the equation of the line that
Q138: Hali is tossing a quarter into the
Q139: Find the equation of the line parallel
Q140: Let f ( x ) = 10
Q142: In an aerobics class, the instructor indicates
Q143: Give the slope and y -intercept for
Q144: Boyle's law states that for low pressures,
Q145: Graph the following relation. Use the graph
Q146: Give the equation of the line perpendicular