Multiple Choice
In 2000 the United States population by age was as follows: under: 15, 22.2%; 15-29, 21%; 30-44, 25.3%; 45-59, 15.8%; 60-74, 10%; 75
And over, 5.7%.
A) 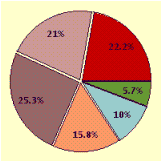
B) 
C) 
D) 
Correct Answer:

Verified
Correct Answer:
Verified
Related Questions
Q110: Consider the following bar graph. How many
Q111: Use the figure below to answer the
Q112: Find the median measurement for the
Q113: The table below gives the female
Q114: <img src="https://d2lvgg3v3hfg70.cloudfront.net/TBX8813/.jpg" alt=" A hygrothermograph is
Q116: Find the mean measurement for the set
Q117: A pharmacist weighed ten different capsules
Q118: Use the data displayed in the
Q119: Find the median measurement for the
Q120: Consider the following bar graph. How many