Multiple Choice
The table below gives the female life expectancy for the given countries. Draw a bar graph for these data.
A) 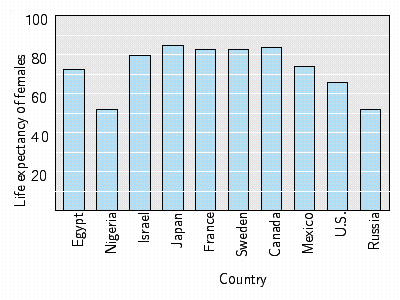
B) 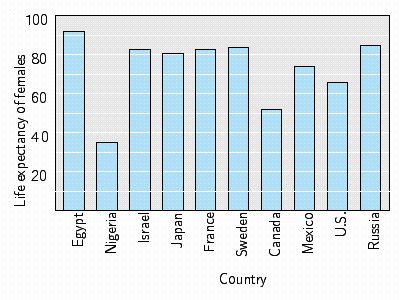
C) 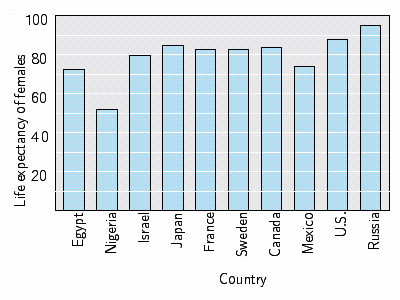
D) 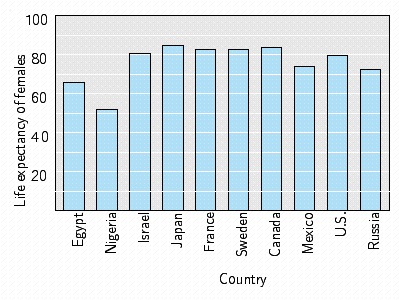
E) 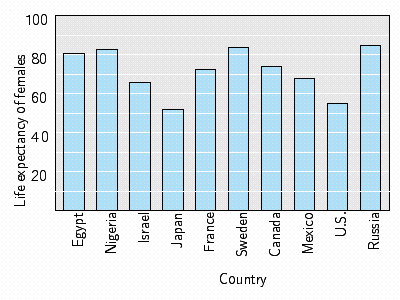
Correct Answer:

Verified
Correct Answer:
Verified
Related Questions
Q108: The life expectancy of a fluorescent
Q109: Consider the following bar graph. How many
Q110: Consider the following bar graph. How many
Q111: Use the figure below to answer the
Q112: Find the median measurement for the
Q114: <img src="https://d2lvgg3v3hfg70.cloudfront.net/TBX8813/.jpg" alt=" A hygrothermograph is
Q115: In 2000 the United States population by
Q116: Find the mean measurement for the set
Q117: A pharmacist weighed ten different capsules
Q118: Use the data displayed in the