Multiple Choice
Draw a circle graph. In 1999, U.S. nonfarm employment was as follows: manufacturing, 17.3 million
Other goods-producing industries, 5.1 million
Private service producing industries, 79.1 million
Government, 21 million
A) 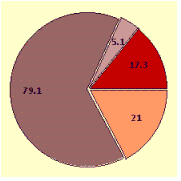
B) 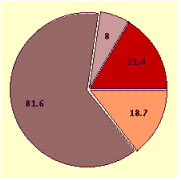
C) 
D) 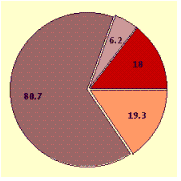
Correct Answer:

Verified
Correct Answer:
Verified
Related Questions
Q33: Use the frequency distribution to find
Q34: Find 39.1% of 360<sup>o</sup> Round your answer
Q35: The sample space is a bag
Q36: The following list gives 50 pieces
Q37: Find the mean measurement for the set
Q39: Find the median measurement for the
Q40: Find the mean measurement for the set
Q41: Consider the following bar graph. How many
Q42: Find the sample standard deviation from
Q43: A certain manufacturing process has a