Multiple Choice
A certain manufacturing process has a target value of 1.20 cm and a standard deviation of ±0.15 cm A sample of nine measurements is made each hour as follows. Draw a mean control chart using data from the table above.
A) 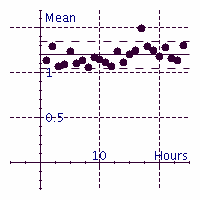
B) 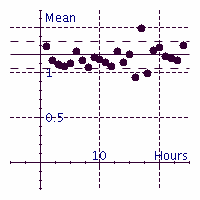
C) 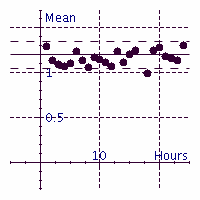
D) 
Correct Answer:

Verified
Correct Answer:
Verified
Related Questions
Q38: Draw a circle graph. In 1999, U.S.
Q39: Find the median measurement for the
Q40: Find the mean measurement for the set
Q41: Consider the following bar graph. How many
Q42: Find the sample standard deviation from
Q44: Find the sample space of the diamonds
Q45: Consider the following bar graph. How many
Q46: A coin is tossed, and a
Q47: Draw a circle graph. In 1996, the
Q48: Find 65% of 360<sup>o</sup><br>A) 306<sup>o</sup><br>B) 270<sup>o</sup><br>C) 234<sup>o</sup><br>D)