Multiple Choice
Use the figure below to answer the following question. 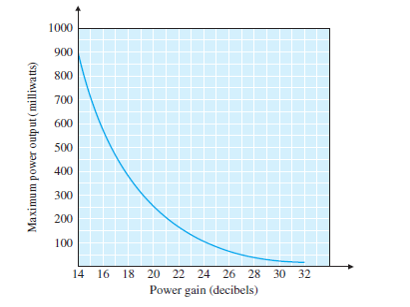 Between what two decibel readings is the greatest change in power output found? (Hint: assume that db readings were taken at the following points: 23, 25, 27, 29, 31, 33, 35, 37)
A) 14 db and 16 db
B) 14 db and 22 db
C) 22 db and 24 db
D) 30 db and 32 db
E) 26 db and 28 db
Correct Answer:

Verified
Correct Answer:
Verified
Q137: Over an eight day period of time
Q138: The sample space of the cards with
Q139: The mileage on six vehicles leased for
Q140: Find the median measurement for the
Q141: Find the sample space of the cards
Q143: <img src="https://d2lvgg3v3hfg70.cloudfront.net/TBX8813/.jpg" alt=" A hygrothermograph is
Q144: A trucking company had hauls of
Q145: Find the median measurement for the
Q146: Find the sample standard deviation from
Q147: Consider the following bar graph. How many